The Item Level Performance Tool report can help your site manage specific items in a department, such as your foodservice items. This report shows the performance and attributes of each item, including margin, inventory and price.
To access this report, go to Favorite Reports menu, select HQ Report List. Then select Item Level Performance.
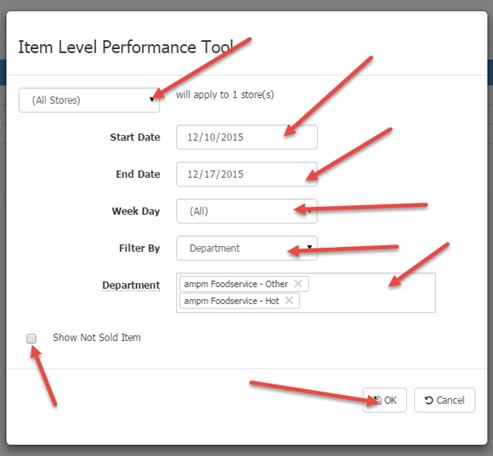
1. Choose the report criteria and date range.
2. If you want just the average for a specific day of the week, then choose a weekday if desired.
3. You can choose by department or sub department by selecting the option under “Filter by”.
4. Select the Department or Sub-Department in the next field it will default to the ampm Foodservice items. Click the X to remove items from this box. To add additional choices click in the box and choose from the list.
5. Checkmark the ‘Show Not Sold Item’ box if you want the report to show items not sold during this time.
6. Click OK when finished and the report will come up for you to save on your local PC.
Below is a sample:
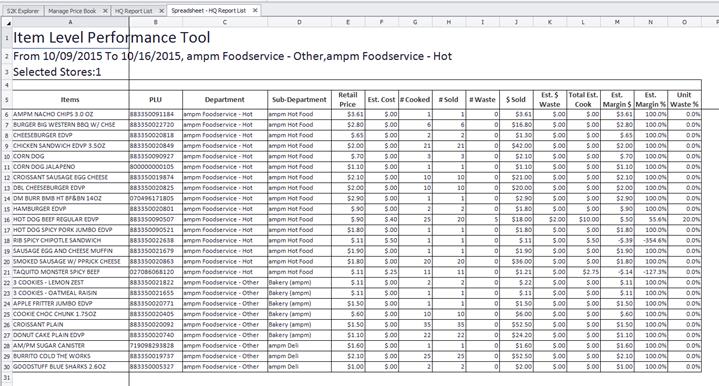
Retail Price comes from the average retail of the item during that date range.
Estimated cost is the cost that is entered in the item detail screen. For Core items, if there is a cost entered under the local attribute cost section, it will be displayed instead of the cost under core attribute. If no cost is entered in these screens, then $0 cost will display. Cost is not populated on the report based on purchases entered in S2k.
#Cooked is the #sold plus # wasted.
#Sold is based on actual sales.
#Wasted is based on Inventory Adjustment invoices entered for the item during the date range entered.
Est. Waste is based on waste times cost of the item.
Total Est. Cooked is based on #cooked times estimated cost of the item.
Est. Margin $ is based on retail price minus unit cost.
Est. Margin % is based on retail price minus unit cost divided by retail.
Unit Waste % is based on #waste divided by #cooked.